Improving C++ compile times using flame graphs
Investigating C++ compile times
- My journey investigating slow compile times in C++
- Useful tools to investigate C++ compile times
- Understanding MSBuild to create flame graphs
- Improving C++ compile times using flame graphs
- Getting data from C++ Build Insights SDK
In the last posts we’ve explored ways to know how long a C++ build takes and how to create flame graphs out of MSBuild’s execution.
This time we’ll check several examples and try make more informed decisions to improve our build times. We’ll see a lot of examples, so expect it to be an image-heavy post!
Understanding MSBuild flame graphs
First of all, we should learn how to read these flame graphs. This one shows a sample build of my (unreleased) GameBoy emulator side project. It’s a Visual Studio 2015 solution that mixes C++, C++/CLI and C# code:
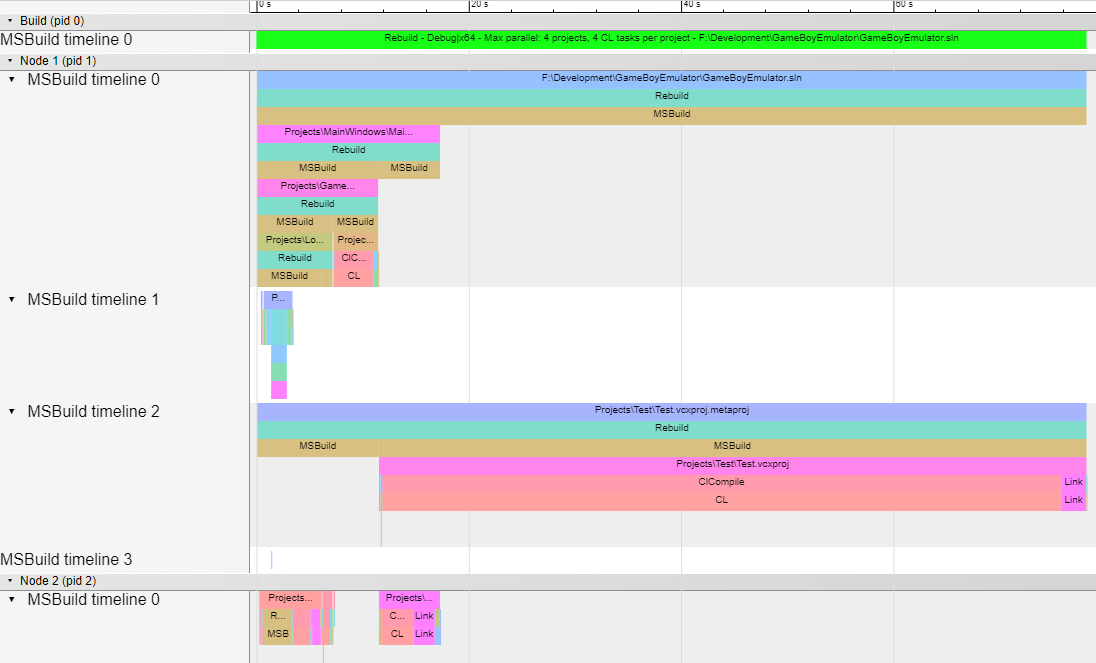
In this graph we’ve got:
- Several
pid: these are theNodeIdvalues as reported by MSBuild. BecauseNodeIdstarts at 1, we’ve used index 0 to tag the build itself. They don’t exactly represent processors, cores or threads (we’ll see an example with a ton of timelines at the end of the post). - Several
MSBuild timeline: they represent different execution hierarchies. Very important notice: they are absolutely made up. MSBuild reports entries (Project,TargetorTask) living in aNodeId, but some of them don’t share the same hierarchy! For these cases, I decided to separate them into different timelines. We talked about hierarchies in the previous post.
It’s a bit hard to explore hierarchies with screenshots, but let’s edit the image above to help us understand what’s going on:
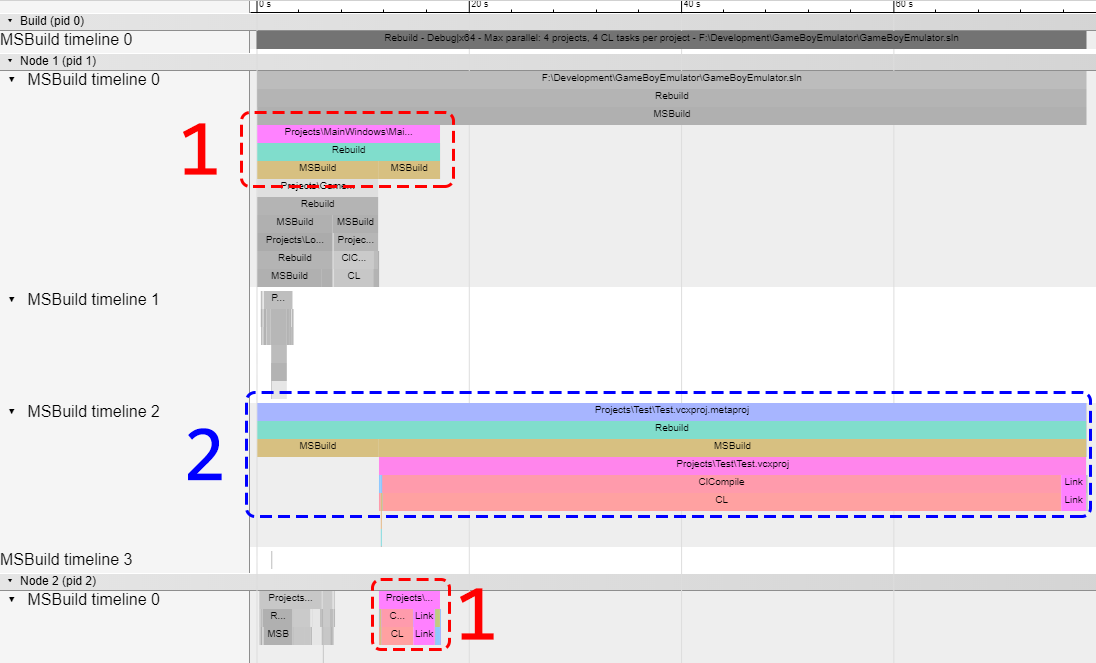
These are the two top-level projects within the solution. In this case, both create an executable (one for the emulator itself, one for the test suite).
Did you notice they’re .metaproj projects? That means they’re created implicitly from the .sln file because they have dependencies (more info in the previous post). See how both of them have two MSBuild tasks? The leftmost task builds its dependencies while the rightmost build the project itself.
In the image, the uppermost group labeled 1 is the MainWindows.vcxproj.metaproj. Its dependencies get built within the same timeline and then builds MainWindows.vcxproj down at NodeId 2. This was kind of surprising for me at first (why not building it within the same timeline, similar to its dependencies?) but that’s how MSBuild reports it.
Meanwhile, Test.vcxproj.metaproj is building in the same NodeId but in a different timeline: they build in parallel because they don’t depend on each other. It also waits for its dependencies (both projects share the same ones), then builds Test.vcxproj.
And what about these dependencies? Let’s zoom in a bit into MainWindows.vcxproj.metaproj and annotate the graph:
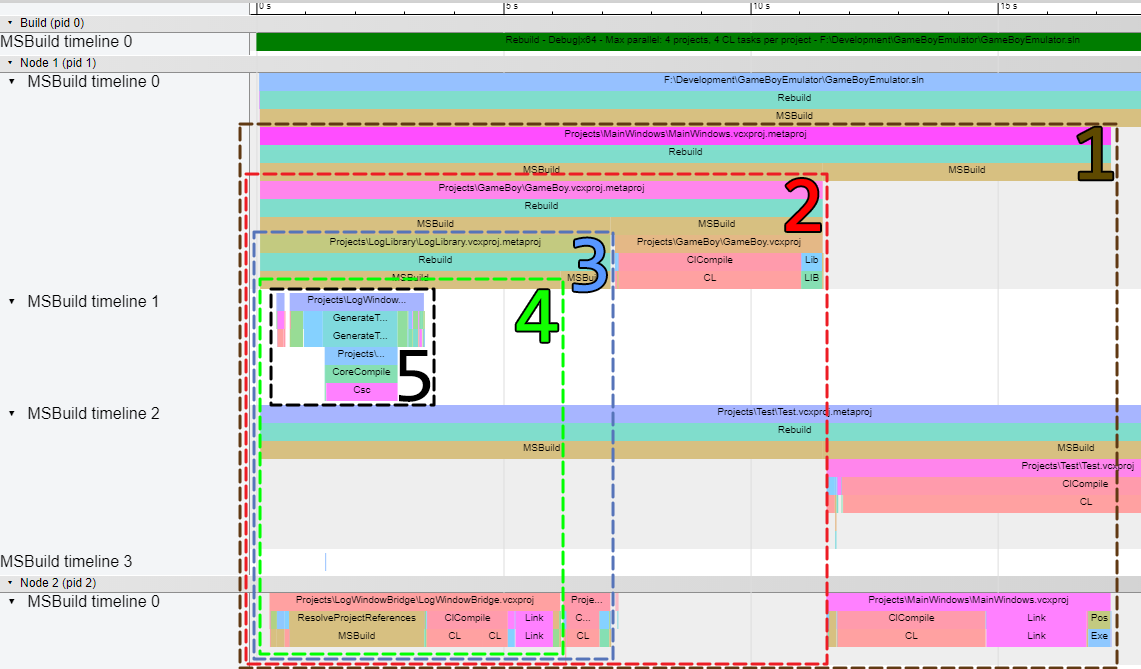
- Group
1isMainWindows.vcxproj.metaproj. It starts inNodeId 1, timeline 0and features twoMSBuildtasks. The rightmost one buildsMainWindows.vcxprojinNodeId 2, timeline 0(I guess it’s because MSBuild scheduledTest.vcxproj.metaprojtoNodeId 1, so this one got moved to a separate one). - Group
2isGameBoy.vcxproj.metaproj. Everything it does lives inNodeId 1, timeline 0. - Group
3isLogLibrary.vcxproj.metaprojand, surprisingly, starts inNodeId 1, timeline 0but does all of its work inNodeId 2, timeline 0. No idea why this jump, that’s how MSBuild scheduled them. - Group
4isLogWindowBridge.vcxproj. Although it has a dependency, there’s no.vcxproj.metaprojthis time. I guess it’s because it depends on a C# project? It does all of its work atNodeId 2, timeline 0, but I’ve painted the group bigger to fit the next one. - Group
5is the last dependency:LogWindowUI.csproj. It gets built inNodeId 1, timeline 1(MSBuild reports it sharesNodeId 1with other entries but they aren’t part of the same hierarchy, that’s why it goes totimeline 1).
I really hope it made things a bit more clear.
We can ask MSBuild to limit parallel projects to 1 and thus flatten them:
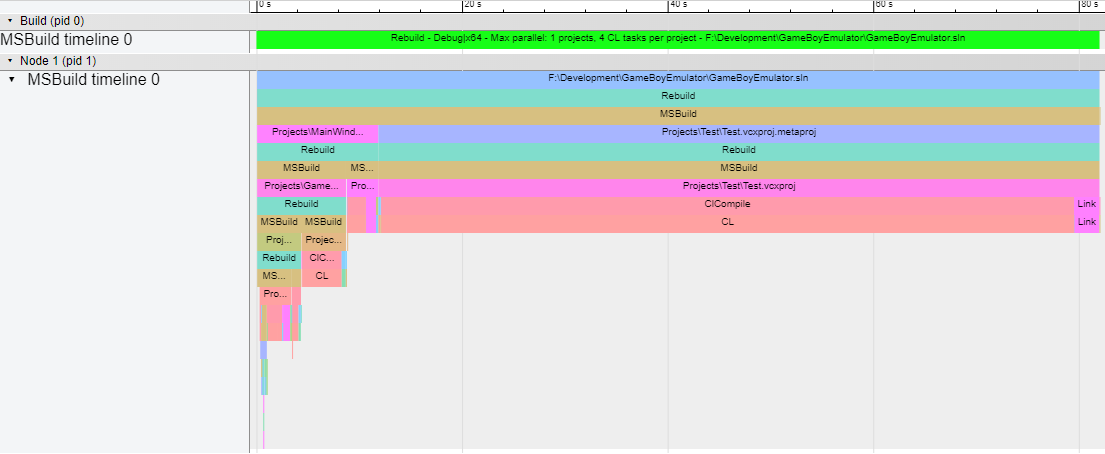
Leftmost entries are the ones that build first while depth represents dependencies.
Adding more info via MSVC flags
In the previous post we explored some MSVC flags that added extra timing information to our build, so we should try using them!
/Bt+
This flag produces this kind of output:
1>  File.cpp
1>  time(Z:\path\to\compiler\c1xx.dll)=0.39427s < 1617765075910 - 1617766036302 > BB [Z:\path\to\File.cpp]
1>  time(Z:\path\to\compiler\c2.dll)=0.06475s < 1617766053824 - 1617766211553 > BB [Z:\path\to\File.cpp]
These messages represent three parts of a file compilation: the start, the end of the compiler’s front-end and the end of the compiler’s back-end. With this, we can create our own entries in the graph and represent each compilation!

Because these entries are absolutely made up, I’ve labeled its timeline as Post-processed timeline to separate them from the raw MSBuild data.
/Bt+ output, for this graph, looks like this:
File1.cpp
time(c1xx.dll) [...] [File1.cpp]
File2.cpp
time(c1xx.dll) [...] [File2.cpp]
[...]
time(c2.dll) [...] [File2.cpp]
time(c2.dll) [...] [File1.cpp]
This means it’s executing the front-end for each file and then the back-end (and in reverse order)! That means we’re not compiling files in parallel, what a mess!
Turns out, this is the default behavior when you create a new project in Visual Studio 2015. Let’s fix it by adding the /MP flag:
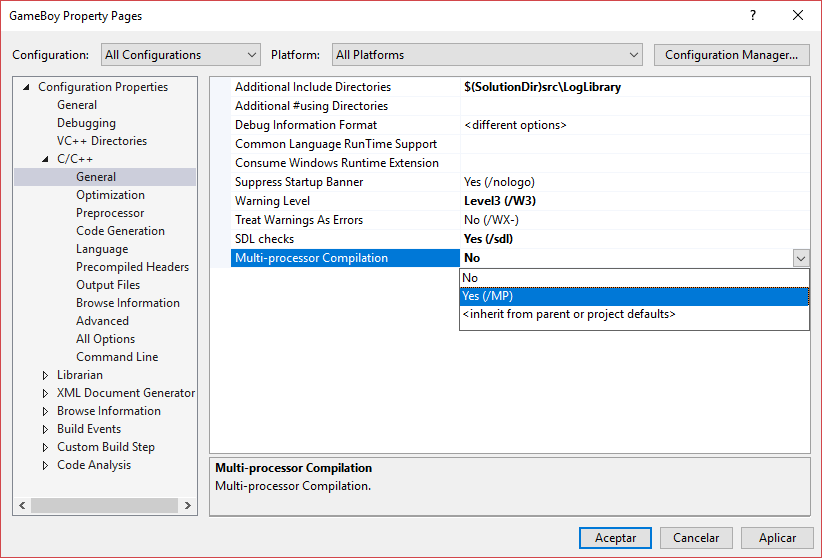
We also have to turn off /Gm because it’s incompatible with /MP:
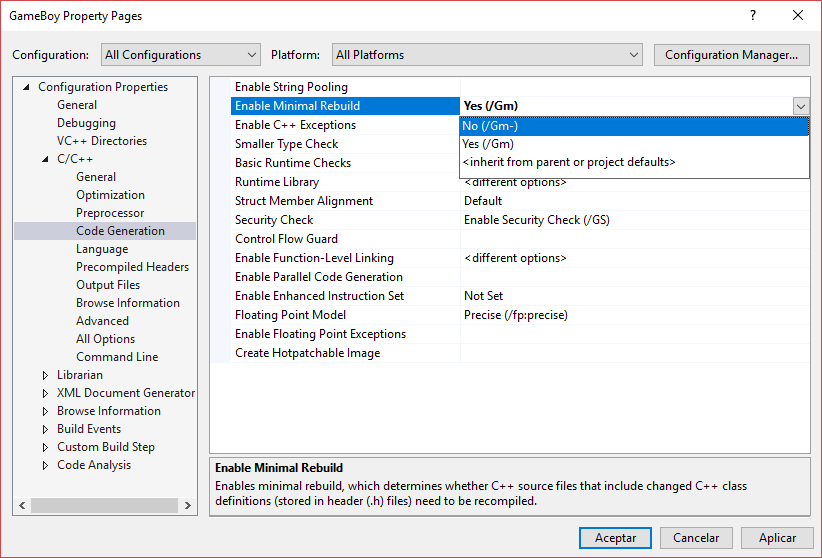
Let’s now rebuild the solution and check again!
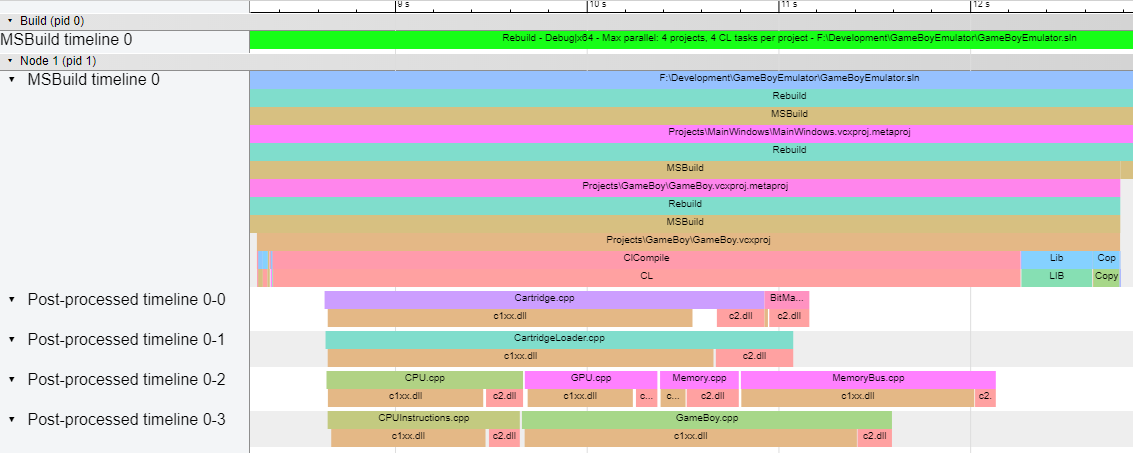
That’s better! Now we can see how there’s as many Post-processed timeline as logical cores. This is the default value, it can be tweaked as well.
Again, because these timelines are made up, it’s not set in stone which file gets compiled in which core. All we have are MSBuild messages saying their compilation started, front-end execution finished and back-end execution finished. With that, we’ve filled the gaps in the logical cores.
Here we hit one big issue: every message within the same Task (CL task in this case) share the same BuildEventContext and other data we could use to tell messages apart. Luckily, /Bt+ messages say which file they refer to so we can know which ones are related. We’ll come back to this issue later on, with /d1reportTime.
Let’s use another project now! This is what /Bt+ has to say when we build the solution from this blog post:
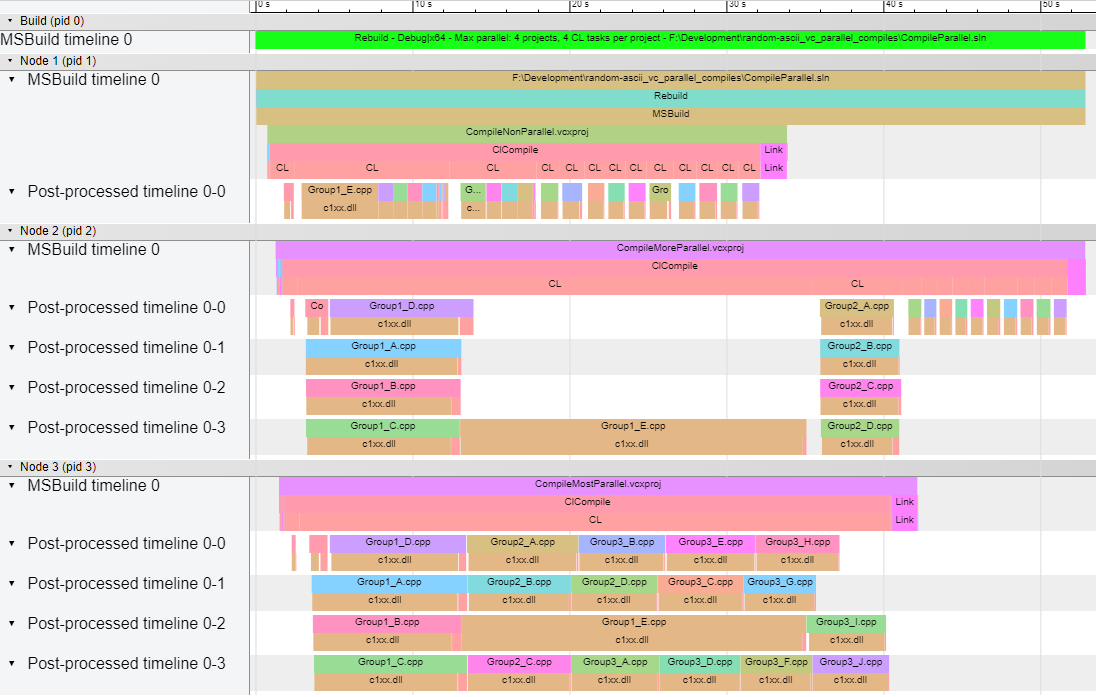
First of all: no project has dependencies. That’s why we don’t find any .vcxproj.metaproj entries. Thanks to this, and because we’ve built the full solution, each project lies into its own NodeId. Let’s explore each one:
CompileNonParallel.vcxproj: it’s doesn’t have/MPenabled (we only see onePost-processed timeline) and it defines groups of files with different compiler flags (it has severalCLtasks).CompileMoreParallel.vcxproj: it has/MPenabled but still defines groups of files with different compiler flags. That’s why we see parallel compilations in theCLtasks with more than one file, but still a lot ofCLtasks.CompileMostParallel.vcxproj: all files share the same compiler flags except the pre-compiled header, that’s why we see twoCLtasks.
But, what does this different compiler flags have to do with having several CL tasks? That’s because MSBuild creates batches of files that can be compiled with the same flags and then spawn as many CL tasks to execute the compiler. When they’re done, a new batch begins.
In the case of pre-compiled headers, you must compile one file with the /Yc flag to create the PCH while other files must compile with the /Yu flag to use that file. Because they’ve got different flags, MSBuild creates two batches.
Bonus: files with the same name
Let’s suppose you’ve got a project with a number of files spread into folders. And let’s say two of the files you’ve got use the same name: File.cpp. When you compile the project you get this warning:
Two or more files with the name of File.cpp will produce outputs to the same location. This can lead to an incorrect build result. The files involved are src\Folder1\File.cpp, src\Folder2\File.cpp.
This is because the default project configuration creates all intermediate .obj files in the same folder. When it compiles the second File.cpp file, its .obj file overwrites the former one. If you queried Google and checked the first answer in Stack Overflow, you’d modify the project with this property:
<ObjectFileName>$(IntDir)/%(RelativeDir)/</ObjectFileName>And this is its trace:

Yes, it built without issues but now we will have as many CL tasks as folders in our project! This is the wrong approach!
Alright, that was a synthetic test, but now imagine you have a processor with 8 or 16 logical cores and the same kind of project. If you’ve got only a handful of files per folder you’d be wasting most of those cores because batches won’t have as many files! You’re destroying parallelism!
You better fix your physical structure instead of doing this, or your build times will suffer. I once decreased the Rebuild time of a project by almost 2 minutes (2 minutes!) with just this change. It can get serious.
/time+
Let’s move onto a linker flag we talked about in the previous post:

That’s a Debug|x64 compilation. Not many info, really. What about a Release|x64 compilation?

By default, Release configurations enable /LTCG (Link Time Code Generation). It first loads all of the .obj files (the small entries to the left of Pass 1) and then generates more optimized code (LTCG CodeGen entry).
/d1reportTime
This is the last flag we’ll be adding to get extra data (check previous post for more info). And it comes with two issues:
- It’s only available from Visual Studio 2017 version of MSVC: this means we need to upgrade the GameBoy emulator project we’ve been using to make it work. Because we were already using MSBuild 15, we can build both VS2015 and VS2017 C++ solutions with the same tool!
- It outputs a huge amount of
Messagetasks for each file and we can’t relate messages to each other (i.e. theirBuildEventContextand other identifiable data match, but they don’t say which file they refer to like/Bt+does). Because files are getting compiled in parallel we’ll get mixedMessagetasks! We need to break parallelism to be able to build a hierarchy.
So let’s first upgrade our project and then ensure we only compile one file at a time. Doing so isn’t a hack either, that’s what the /showIncludes MSVC flag does (it shows a warning saying so, although it doesn’t get mentioned in the official docs).
Let’s take an example now!
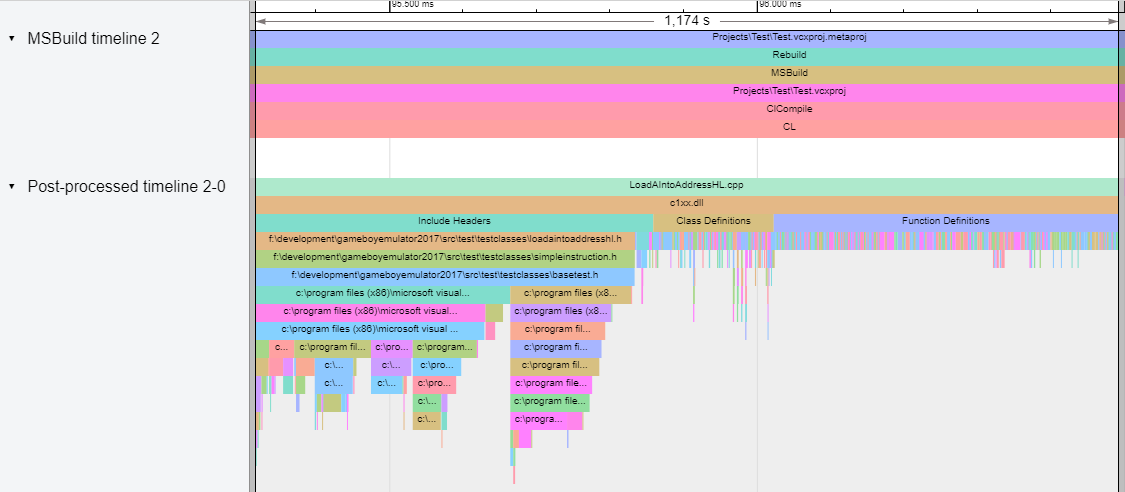
This is one of my test files: LoadAIntoAddressHL.cpp. As reported by /d1reportTime, the front-end executes three sections: Include Headers, Class Definitions and Function Definitions. Again, all these entries are made up and that’s why they are in a Post-processed timeline.
Bonus: /Bt+ and /d1reportTime timing flaw
Let’s take the combined output for /Bt+ and /d1reportTime for this file and remove a lot of the messages, let’s just keep timing ones:
[...]
LoadAIntoAddressHL.cpp
Include Headers:
  [...]
  Total: 0.591067s
Class Definitions:
  [...]
  Total: 0.178967s
Function Definitions:
  [...]
  Total: 0.511502s
time(Z:\path\to\compiler\c1xx.dll)=1.17362s < 2283035638380 - 2283038497179 > [Z:\path\to\LoadAIntoAddressHL.cpp]
Let’s sum /d1reportTime sections: 0.591067s + 0.178967s + 0.511502s = 1.281536s. However, /Bt+ reports the front-end took 1.17362s! Disaster!
If we were to use these times in the graph as they’re reported, the Function Definitions entry would overflow c1xx.dll. To fix it I decided to scale down each child of c1xx.dll proportionally so all of them fit. This was a compromise, though: their times aren’t real anymore but still give you an idea of their relative impact.
Adding pre-compiled headers to the mix
With /d1reportTime data at hand, let’s add this PCH to the project and check how it changes:
#pragma once

#include <vector>
#include <string>
#include <iomanip>
#include <sstream>
First of all, we can see the Include Headers section features a smaller number of files and hierarchies: the biggest ones we had came from the STL! Class Definitions also has less entries: we can even read some of them at the same zoom level! And what about Function Definitions? It’s got far less entries now!
No wonder why the time spent on this file went down from 1.174s to 0.161s! Why don’t we compare how the Test.vcxproj project build time changed with the PCH?
This is how it looked before the PCH:
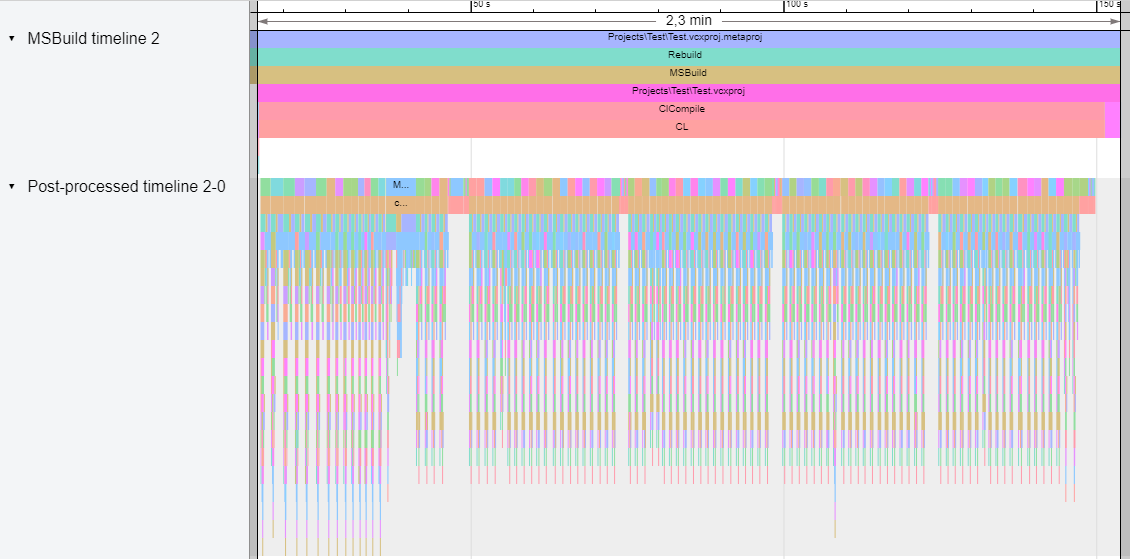
Let’s add the PCH now:
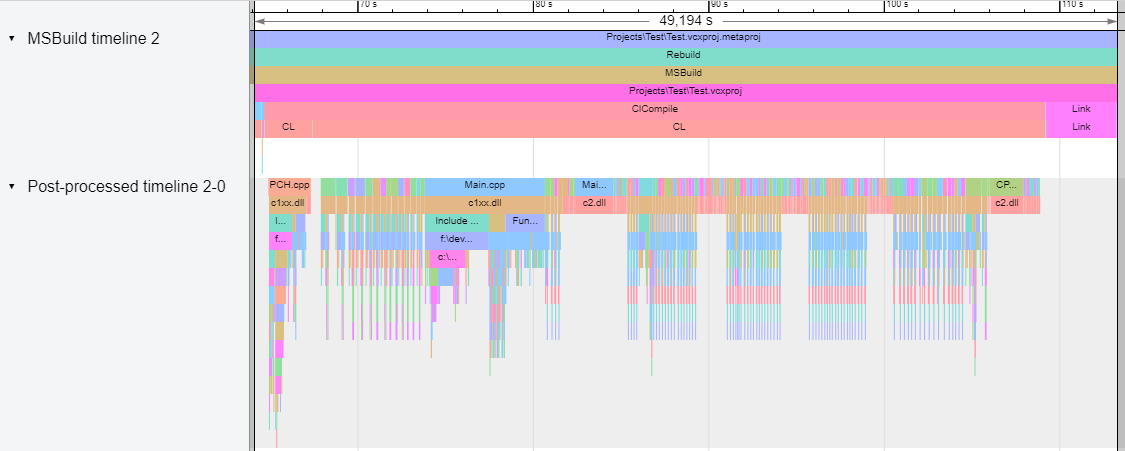
See how the PCH has cut a lot of depth on each file? Also, the full project went down from 2m17s to 49s, and that’s with /MP turned off! What if we turned it on?
This is how it looked before the PCH:

Let’s add the PCH now:

It’s gone from 1m08s to 27s! Also, have you noticed how each c1xx.dll entry has shrunk in size?
To sum up: we can check build times thanks to these flame graphs but also visualize the impact of our changes!
Extra examples
To finish this post I’ve built a couple of projects from GitHub to see how their flame graphs look like. Let’s check them!
RapidJSON
This is the flame graph for RapidJSON when building the whole solution in Debug|x64 with /Bt+ and /time+ enabled. Be warned, it’s large:

With the info from this post, can you tell whether /MP is enabled for this build?
For reference, this is what Paralel Builds Monitor has to say of the build:
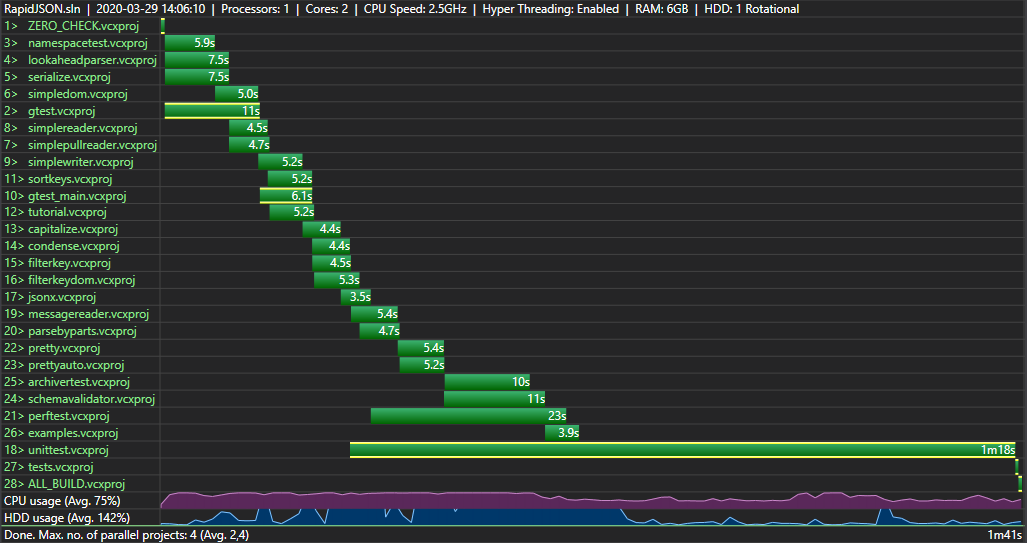
See how the maximum number of projects building in parallel is 4? That’s the number of logical cores in the machine I used to build it.
Google Test
This one is for Google Test, Debug|x64. While RapidJSON built 28 projects, this one builds 80! We’ll have to see it as a downscaled gif instead of a huge screenshot:
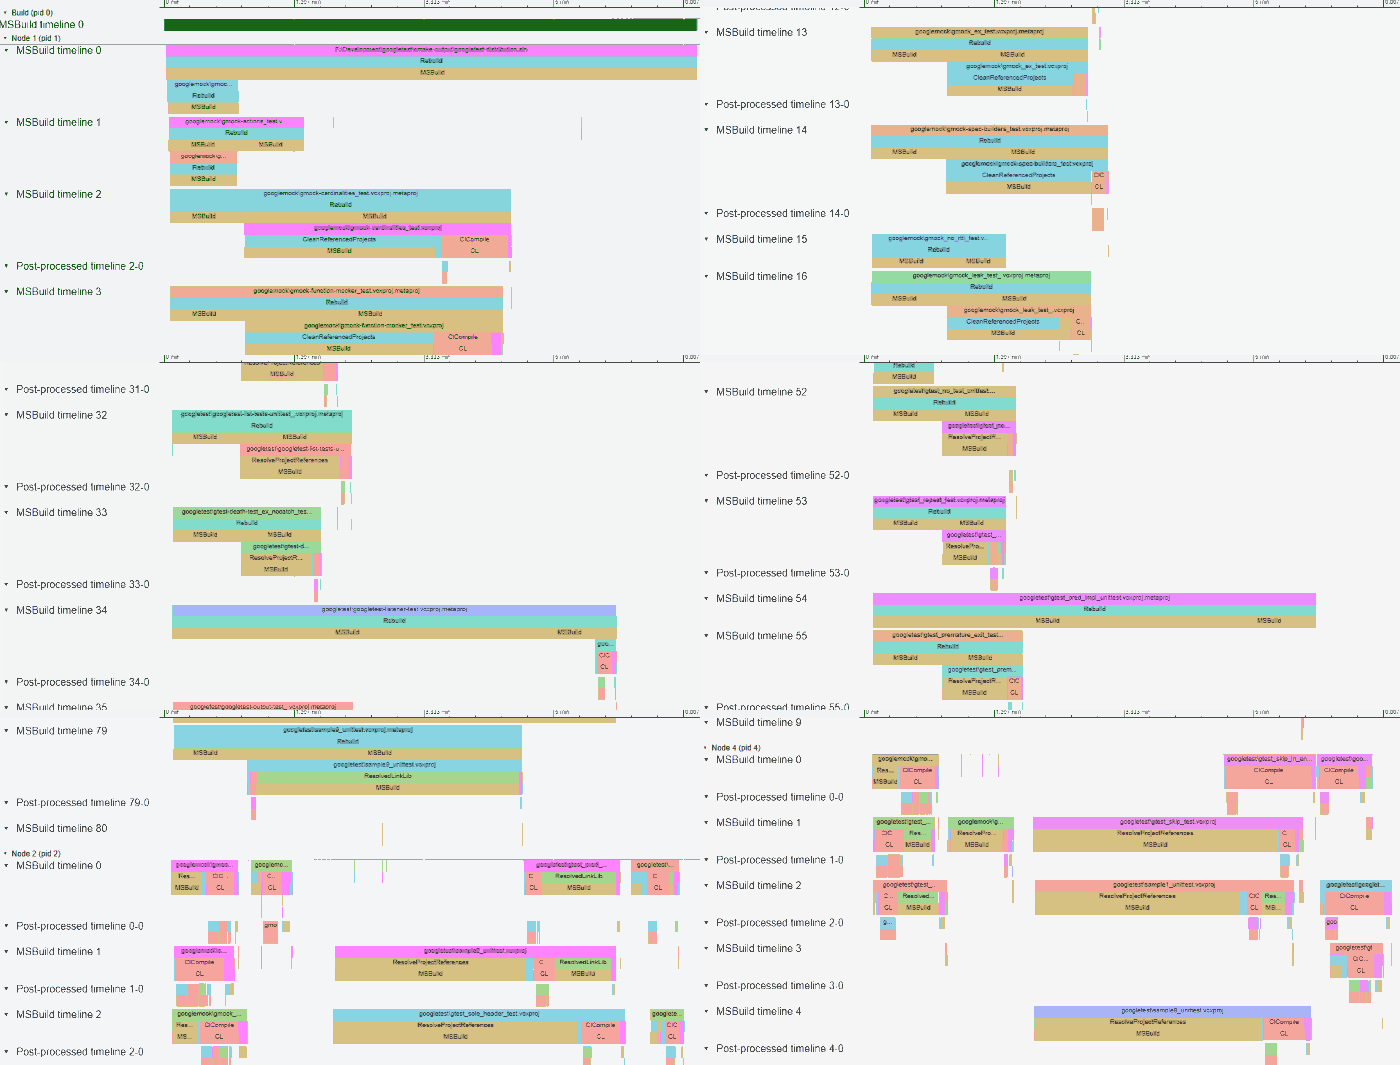
This series has focused on exploring and understanding MSBuild to create flame graphs we could view in Google Chrome’s trace viewer. We’ve learned about MSVC flags and other interesting tools as well. Thanks to them we can make more informed decisions when improving build times and be able to measure their impact.
I hope any of this info was useful for you, it definitely was for me.
Thank you for your time, dear reader!
Update #1: I’ve decided to release this tool at GitHub so anyone can have a try. Thanks for all the support!
Investigating C++ compile times
- My journey investigating slow compile times in C++
- Useful tools to investigate C++ compile times
- Understanding MSBuild to create flame graphs
- Improving C++ compile times using flame graphs
- Getting data from C++ Build Insights SDK
